4K TV Reduce Bitrate3 Min Read Dror GillonNovember 4, 2016 We Need a Revolution of 4K! Don’t panic or stop reading, we used the word ‘revolution’ in the title and though admittedly it’s provocative being less than a week from the…
4K TV HEVC OTT4 Min Read Dror GillonOctober 24, 2016 4 Facts about 4K We recently did a little investigative research on the state of 4k and here are four highlights of what we found. To start, as an industry,…
4K TV AVC Content Everywhere H.264 HEVC OTT Reduce Bitrate V.264 Codec SDK V.265 Codec SDK VCT5 Min Read Dror GillonSeptember 9, 2016 Translating Opinions into Fact When it Comes to Video Quality This post was originally featured at https://www.linkedin.com/pulse/translating-opinions-fact-when-comes-video-quality-mark-donnigan In this…
4K TV AVC H.264 HEVC VCT5 Min Read Dror GillonAugust 26, 2016 VCT, the Secret to Confident Subjective Video Quality Testing We can all agree that analyzing video quality is one of the biggest challenges when evaluating codecs. Companies use a combination of…
4K TV AVC Encoder Applications H.264 HEVC OTT V.264 Codec SDK V.265 Codec SDK VR5 Min Read Dror GillonAugust 8, 2016 Will Virtual Reality Determine the Future of Streaming? As video services take a more aggressive approach to virtual reality (VR), the question of how to scale and deliver this bandwidth intensive…
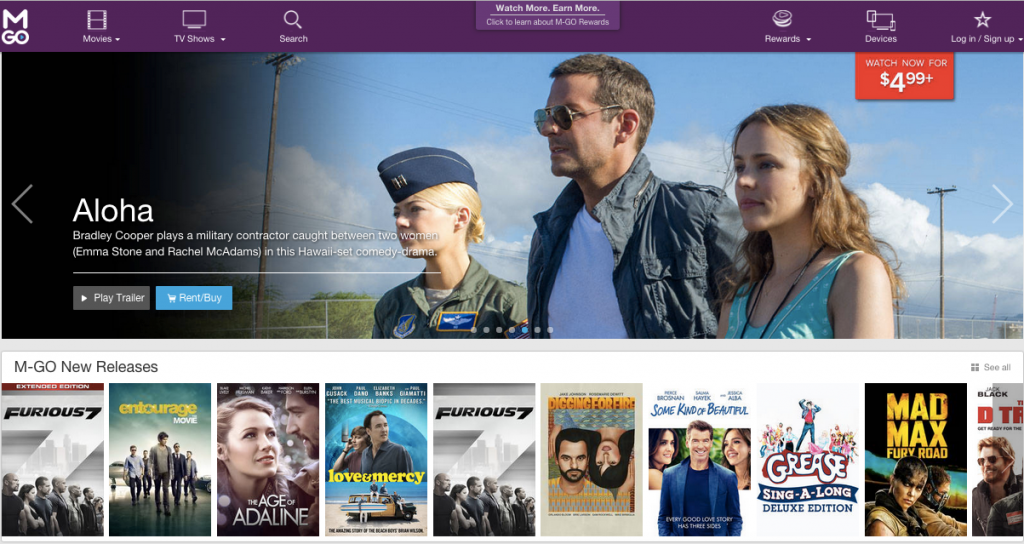
4K TV2 Min Read Dror GillonJanuary 5, 2015 M-GO Upgrades Streaming UX With Beamr Video It is with great joy and excitement that we announce a new member to the Beamr Video family: M-Go, a premium over-the-top VOD service that is…
4K TV1 Min Read Dror GillonDecember 8, 2014 Using Media Optimization to Improve Streaming Performance Back in November, we attended Streaming Media West, where our Director of Sales and Strategy, Mark Donnigan, moderated a panel on Media…
4K TV1 Min Read Dror GillonNovember 21, 2014 Industry Executives Acknowledge Beamr’s Media Optimization Leadership This week at Streaming Media West, Beamr’s Director of Sales and Strategy, Mark Donnigan, moderated a panel on Media Optimization at Streaming…
4K TV1 Min Read Dror GillonNovember 18, 2014 Beamr Video is Heading to Streaming Media West UPDATE: Watch the video here. We are headed to Streaming Media West in Huntington Beach, California! This is the place to learn all about…
4K TV3 Min Read Dror GillonOctober 15, 2014 How Clogged Will the Internet be by 2020? How clogged will the internet be by 2020? Well, let’s take a look at a few things. The number of TV sets connected to the internet will reach…