
ML-Safe Testing Series, Part 5: 3D detectors for autonomous vehicles depend on fine visual cues – the kind that may not survive compression. We built the most sensitive 3D object detection test we could with video data compressed by Beamr technology – and the model’s performance remained substantially intact, preserving detections, predictions, and positions
A single autonomous vehicle generates terabytes of camera data per day. Scale that across a development fleet and the storage and bandwidth costs become a defining infrastructure challenge. Video compression is the natural solution, but when the data feeds perception models rather than human viewers, a different question takes priority: does compression change what the model sees?
Conventional quality metrics can confirm a frame looks identical to a viewer, but they cannot tell you whether a neural network’s depth estimate shifted by just enough to matter. To find out, we designed a deliberately fragile test: a canary in the detection pipeline. We found that with the right compression the model’s decisions remain substantially intact.
Why 3D detection raises the stakes
For autonomous driving, knowing that a car is in the image is not enough; the system needs to know where it is in 3D space: how far away, how large, and which direction it’s facing. Unlike 2D detection, which places a rectangle around an object, a 3D detector estimates real-world position, depth, dimensions, and orientation – relying on precisely the visual cues that compression is designed to discard.
Depth is inferred from subtle gradients in apparent size and perspective convergence; orientation depends on fine edge geometry. These are exactly the high-frequency details that quantization rounds away. Even small shifts can nudge a depth estimate by meters while the image still looks the same to a human viewer, making 3D detection a natural stress test for compression.
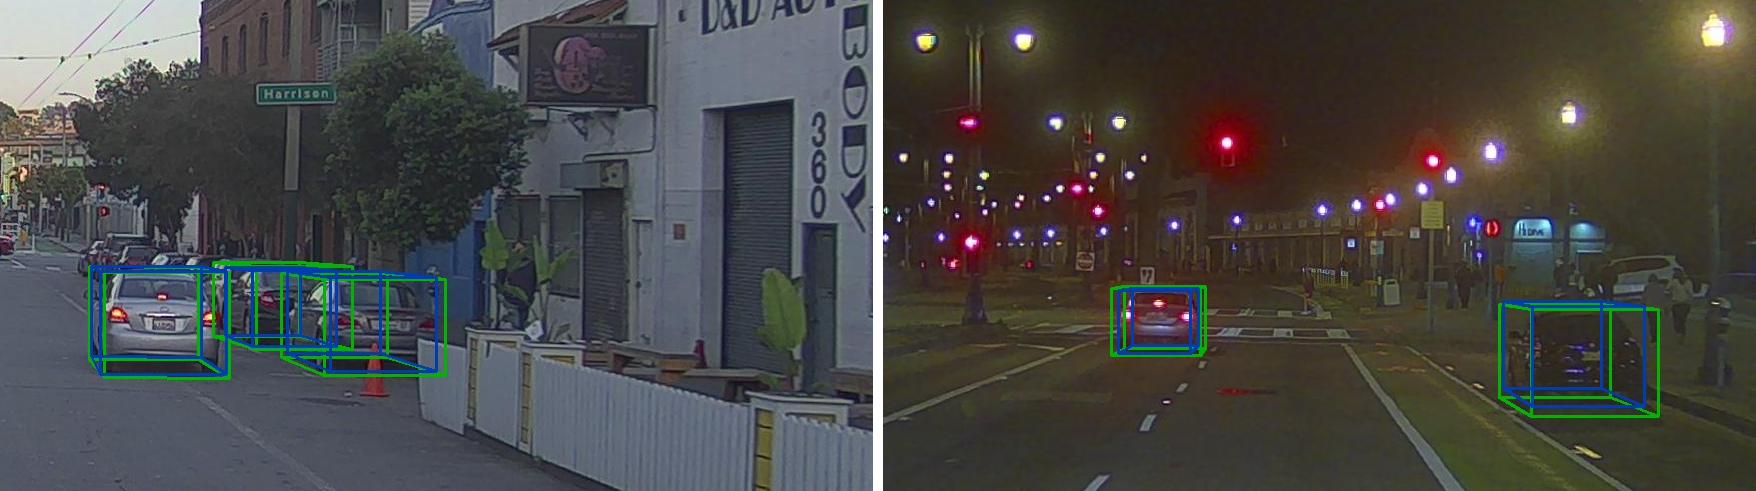
Figure 1: MonoDETR’s 3D predictions (blue) overlaid on ground-truth annotations (green) across daytime and nighttime PandaSet driving scenes. The model estimates each vehicle’s relative position, depth, and orientation from a single camera image.
We designed a deliberately challenging setup: a monocular 3D detector (MonoDETR) running on driving footage it was never trained on. Without multiple sensors, temporal context, or familiar data, the model is far more likely to reveal compression-induced changes – a canary in the coal mine. We compared the model predictions on source JPEG frames against 11 HEVC compression settings across 103 PandaSet sequences (~48,000 ground-truth objects).
Perceptually lossless bitrate
Instead of a single pass/fail quality score, we evaluate compression through a rate-retention-stability profile: how many detections survive, whether their accuracy changes, and what trade-offs each encoding setting offers.
The compression results span standard NVIDIA NVENC encoding at CQ 15-35 – offering compression in the range of 43% to 93% – and Beamr’s Content-Adaptive Bitrate (CABR) optimization, which reduces bitrate by up to 32% beyond standard encoding at matched quality levels.
Our analysis reveals a sweet spot near CQ 20-25. Below that range, retention stays above 96%, 3D overlap with ground truth is effectively unchanged, and overall detection quality (F1 score) remains at or above source levels. Above it, the trade-off steepens: True positive (TP) loss exceeds 6% and the most vulnerable sequences retain only 50% of baseline detections (see the full research for the full degradation profile).
At every CQ level tested, CABR achieves lower bitrate than standard NVENC while maintaining comparable retention. At CQ 20, a representative moderate setting, CABR reduces bitrate by 29% (6,419 vs. 9,049 kbps) with TP retention of 96.3% vs. 96.7%.
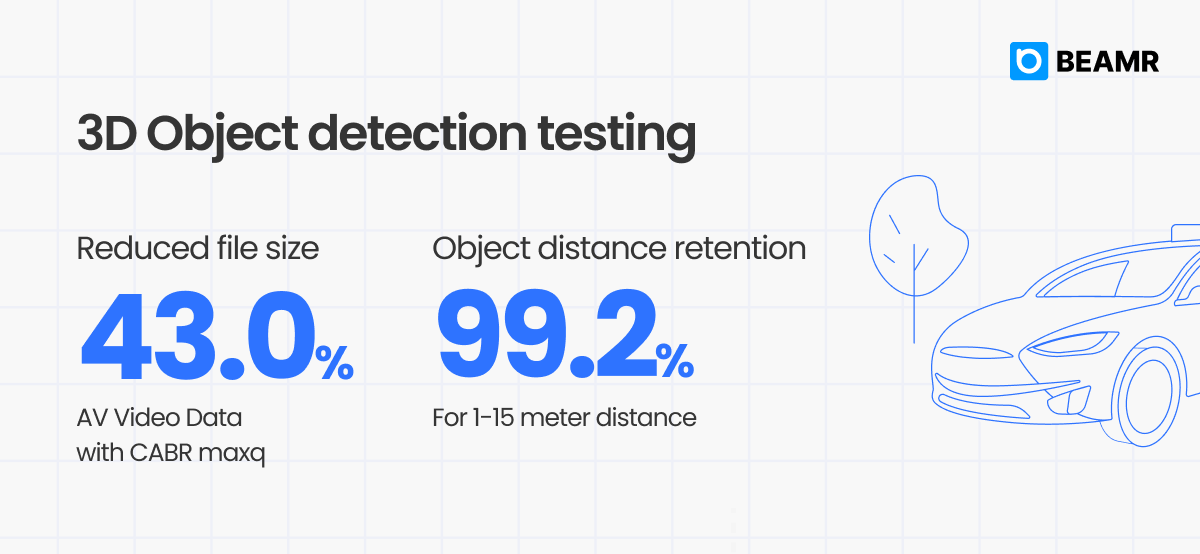
CABR maxq deserves special attention: it automatically selects the lowest perceptually lossless bitrate with no CQ tuning required. In this study, maxq achieved 97.1% TP retention while reducing bitrate by 43% compared to source JPEG frames.
Compression preserves prediction accuracy
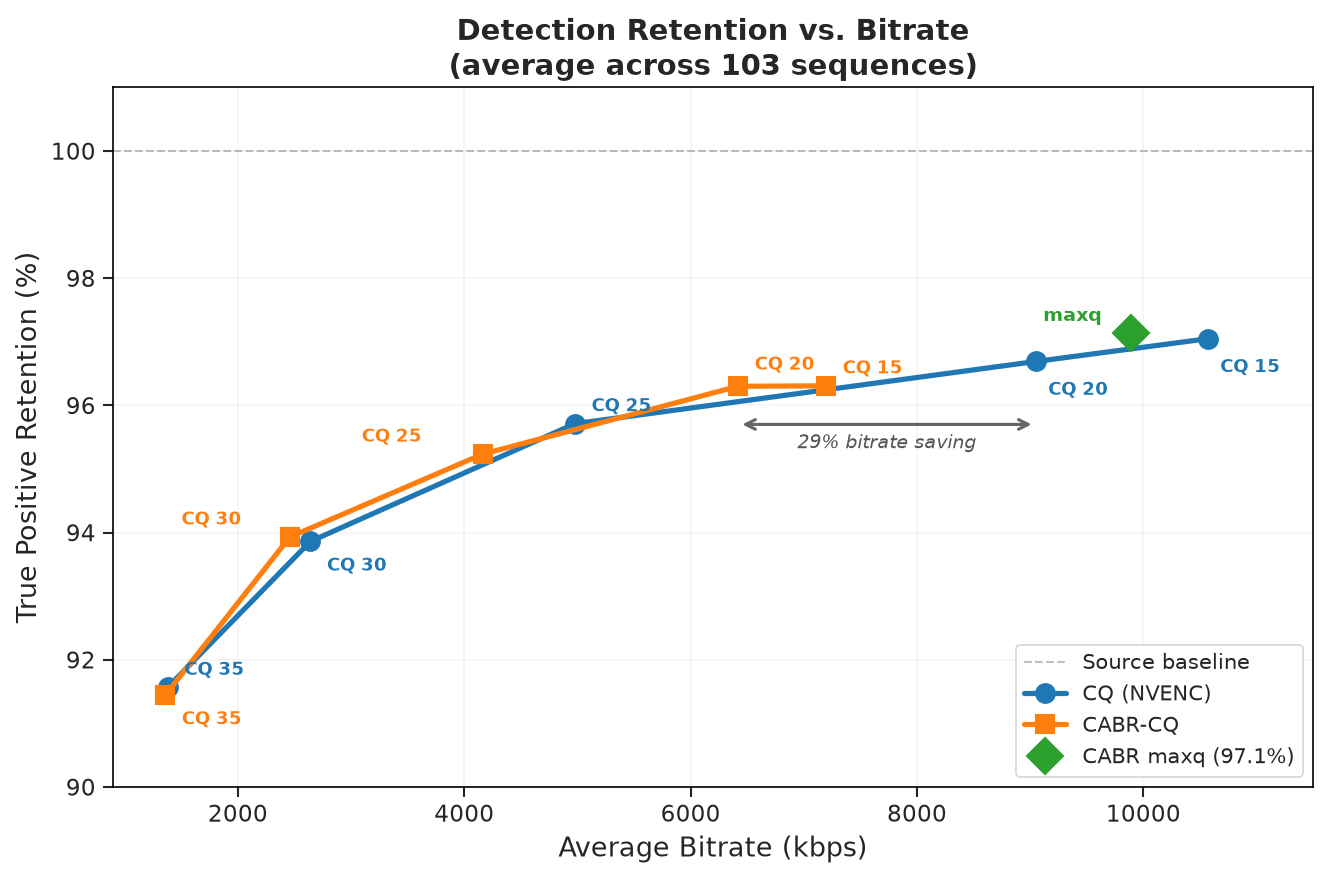
Figure 2: CABR-CQ consistently achieves lower bitrate at comparable retention. Retention is the share of correct detections from the source frames that survive after compression; bitrate is how much data the compressed video uses relative to the source. Each point in the graph is one compression setting: standard encoding (CQ, blue) and content-adaptive encoding (CABR-CQ, orange). Further left means less storage, higher up means more detections preserved.
Retention tells us whether detections survive; the next question is whether surviving predictions become less accurate. We measure this through the change in 3D IoU between each prediction and its matched ground-truth (GT) object, before and after compression.
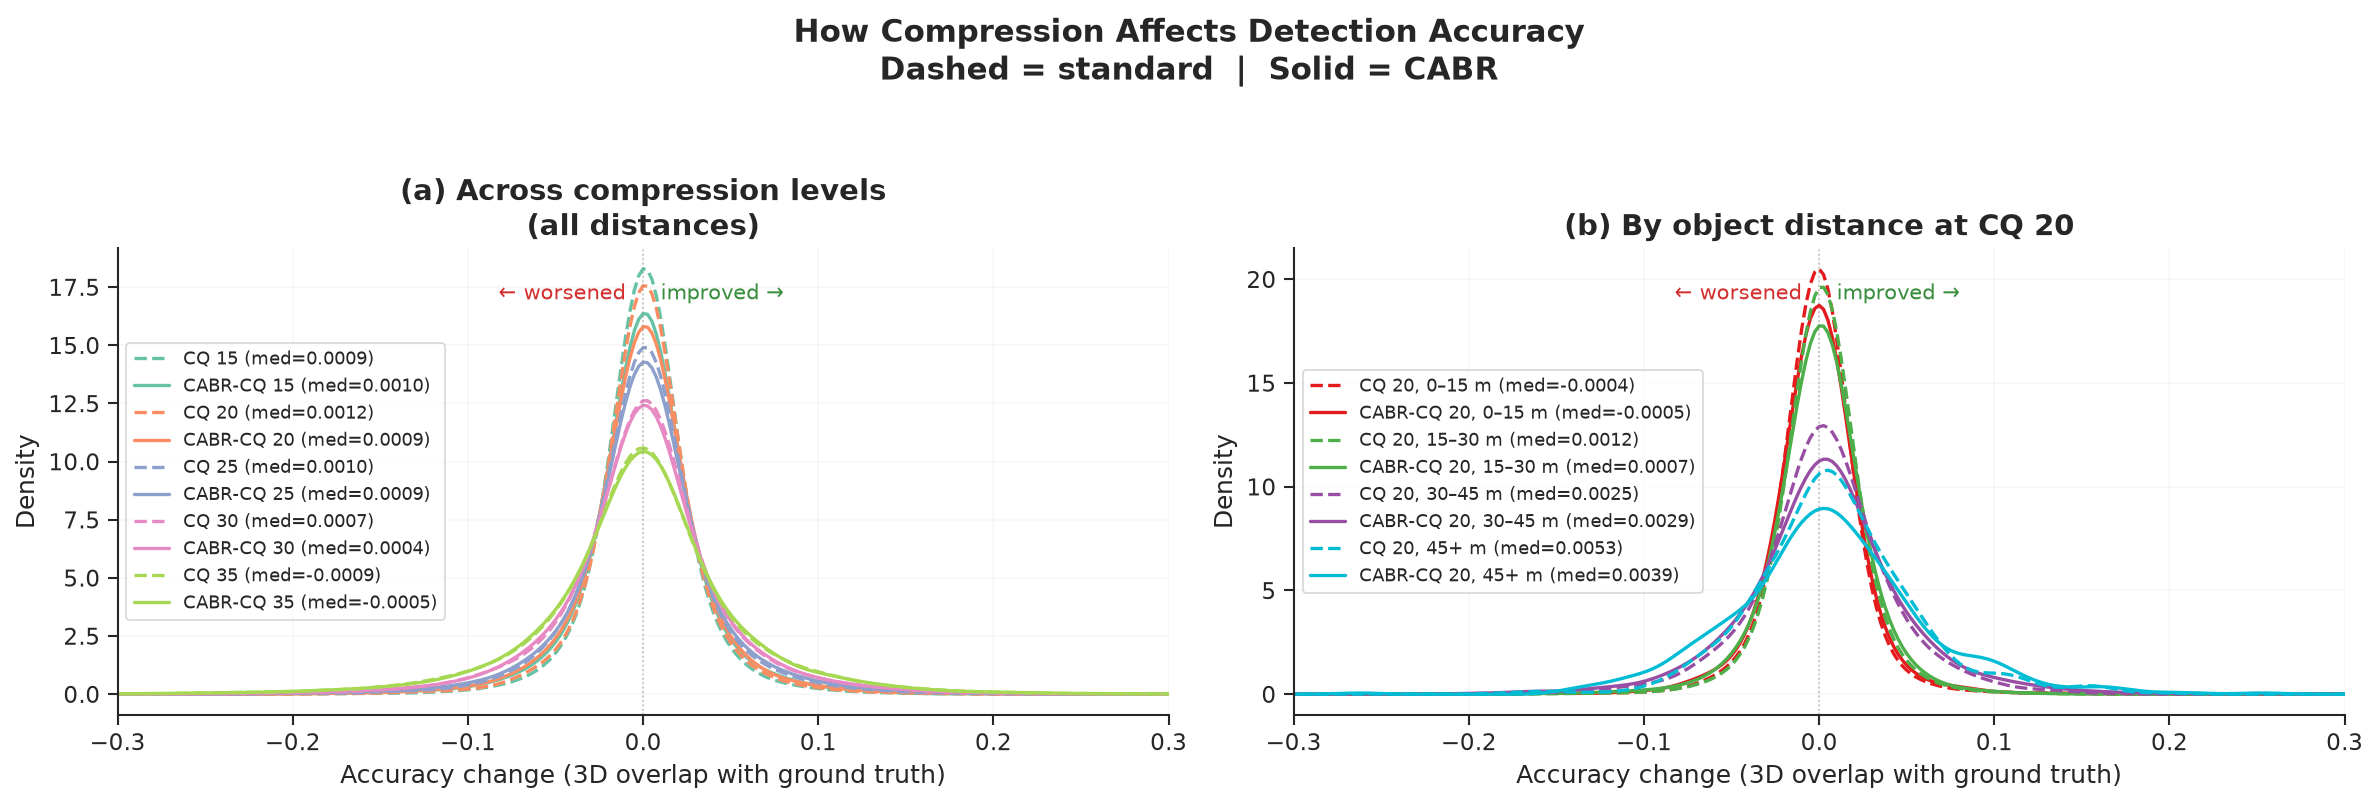
Figure 3: Distribution of accuracy change for matched detections after compression. A value of zero means compression had no effect; negative means slightly worse, positive means slightly better. Panel (a) shows all compression levels across all distances; panel (b) breaks down CQ 20 by object distance. Dashed = standard encoding; solid = CABR.
The central pattern is clear: compression does not systematically degrade 3D localization accuracy. Shifts are sharply concentrated around zero: even at CQ 35, the most aggressive setting, 90% of predictions shift by less than 0.09 IoU, and this holds across all object distances.
What does this look like in practice?
The numbers above describe thousands of predictions in aggregate. Here is what a typical detection looks like before and after compression:
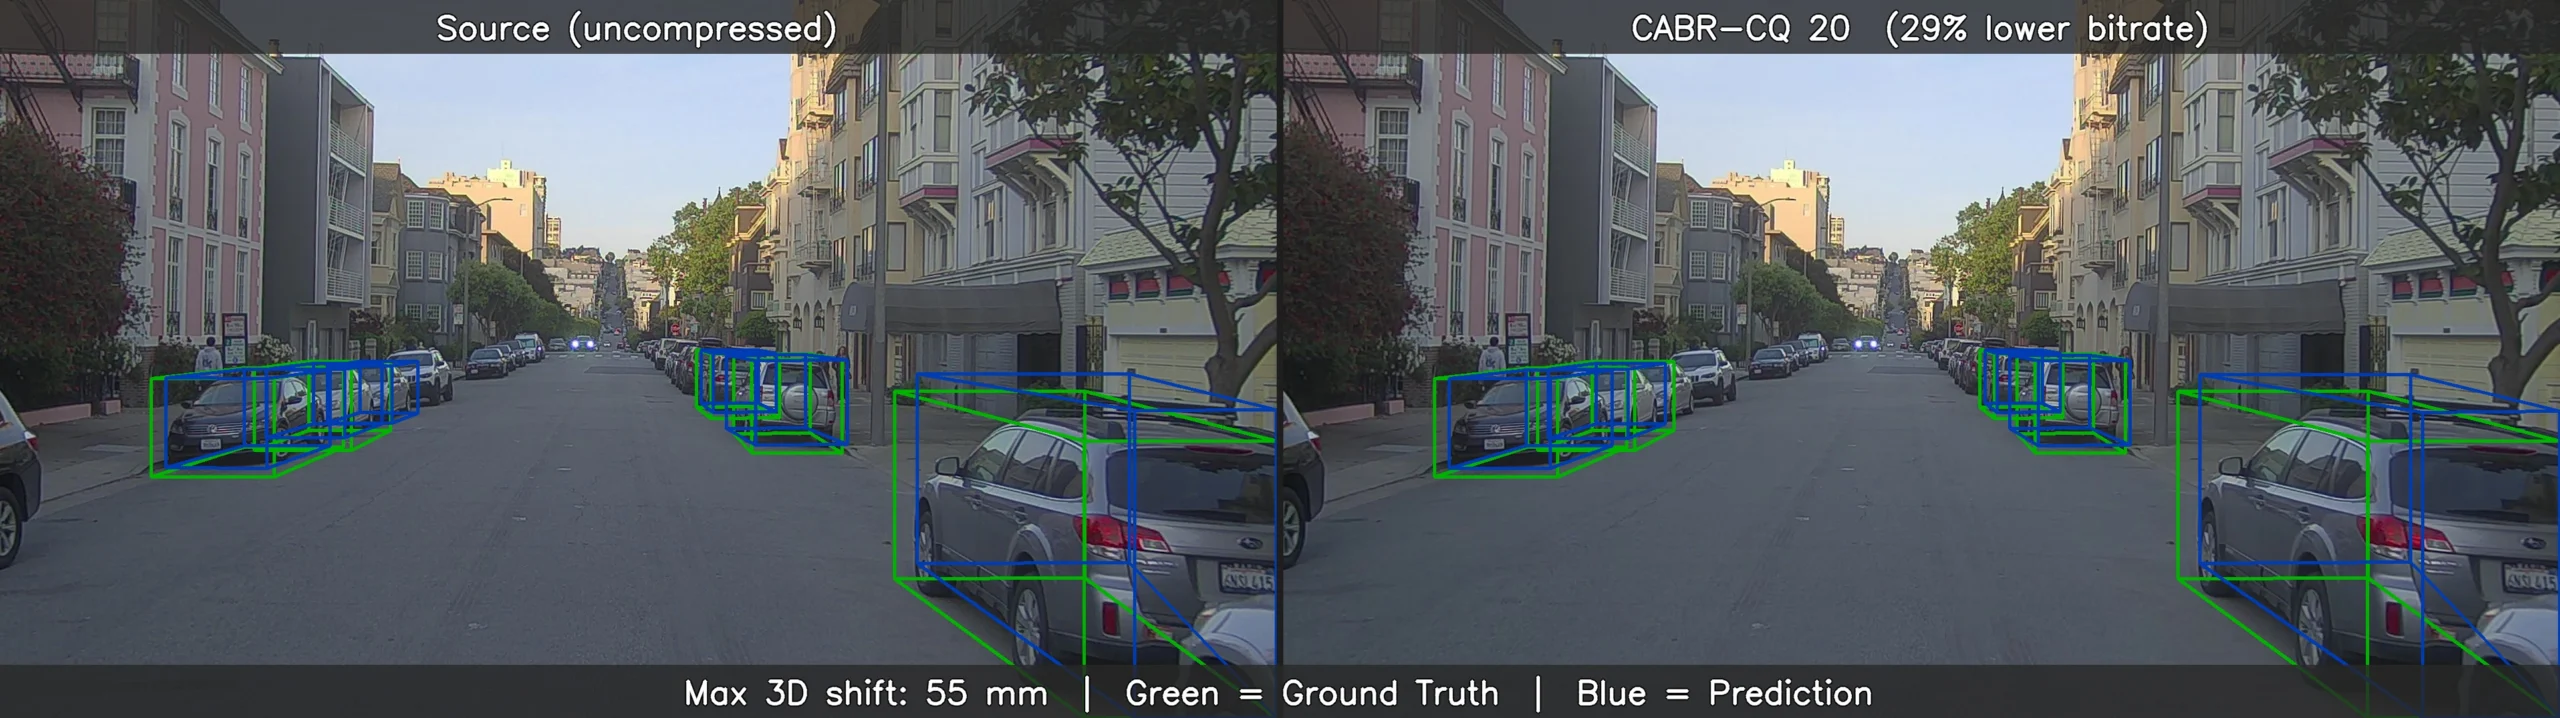
Figure 4: Source frame (left) vs. CABR-CQ 20 compressed frame (right) for the same scene. Ground truth in green, model predictions in blue. Matched detections shift by just 3 to 55 mm in 3D space; the bounding boxes are visually indistinguishable. This is the dominant outcome across the full dataset: compression introduces negligible geometric change, spanning urban intersections, highways, parking lots, and varied lighting conditions across all 103 sequences.
The detections that matter most are the least affected
A natural concern is that compression might silently corrupt the model’s most reliable predictions. The data shows the opposite: high-confidence detections maintain at least 98% retention across all compression settings. Losses concentrate among low-confidence, far-range, and partially occluded predictions where the model was already least certain: at CQ 20, predictions that lost TP status already had a mean GT IoU of just 0.22 vs. 0.41 for stable detections. Compression didn’t degrade good detections, it only nudged predictions already barely associated with their ground-truth objects, pushing them just past the matching boundary. It also introduced virtually no new false positives (see Full research, Section 4.3).
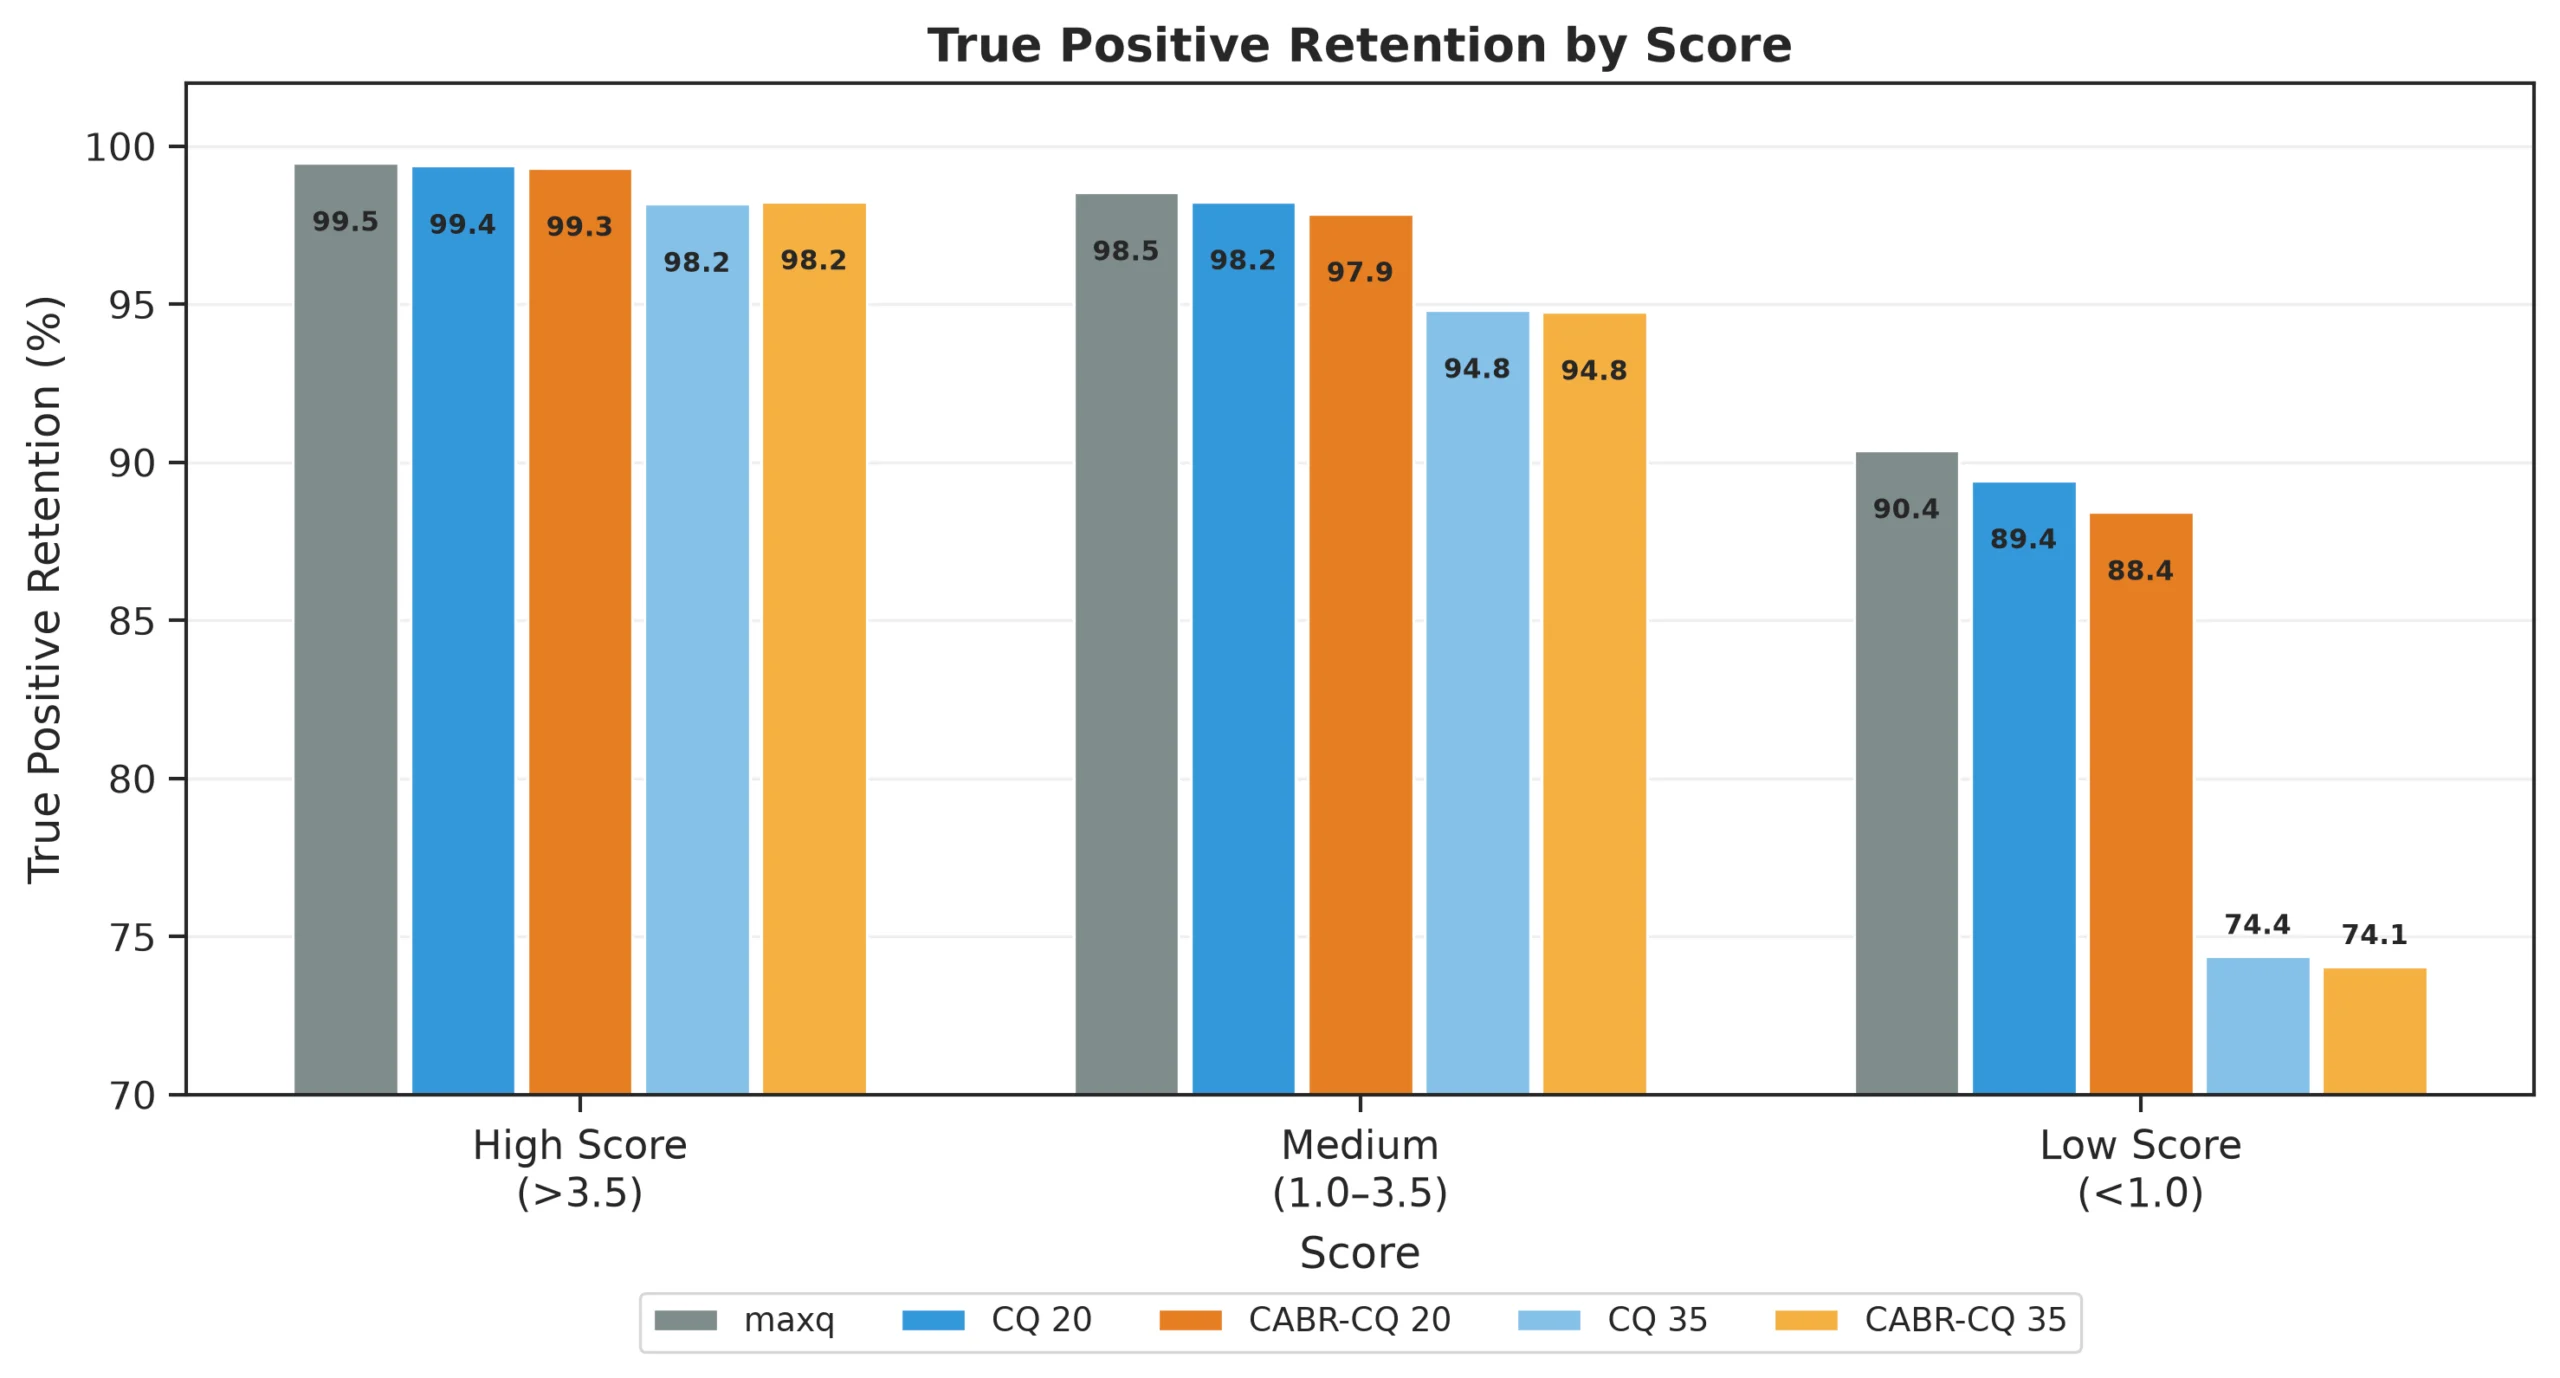
Figure 5: True Positive retention by detection confidence score across compression settings. Retention is the percentage of correct detections from the source frames that remain correct after compression. High-confidence predictions (score above 3.5) are nearly unaffected; low-confidence predictions (score below 1.0) show the steepest decline with stronger compression.
Distance tells a similar story: mid-range objects (15-30 m) hold near 97% retention even at CQ 25, while far-field objects (45+ m) are most vulnerable. Across distance bands, compression strength, not encoder choice, is the primary driver of retention.
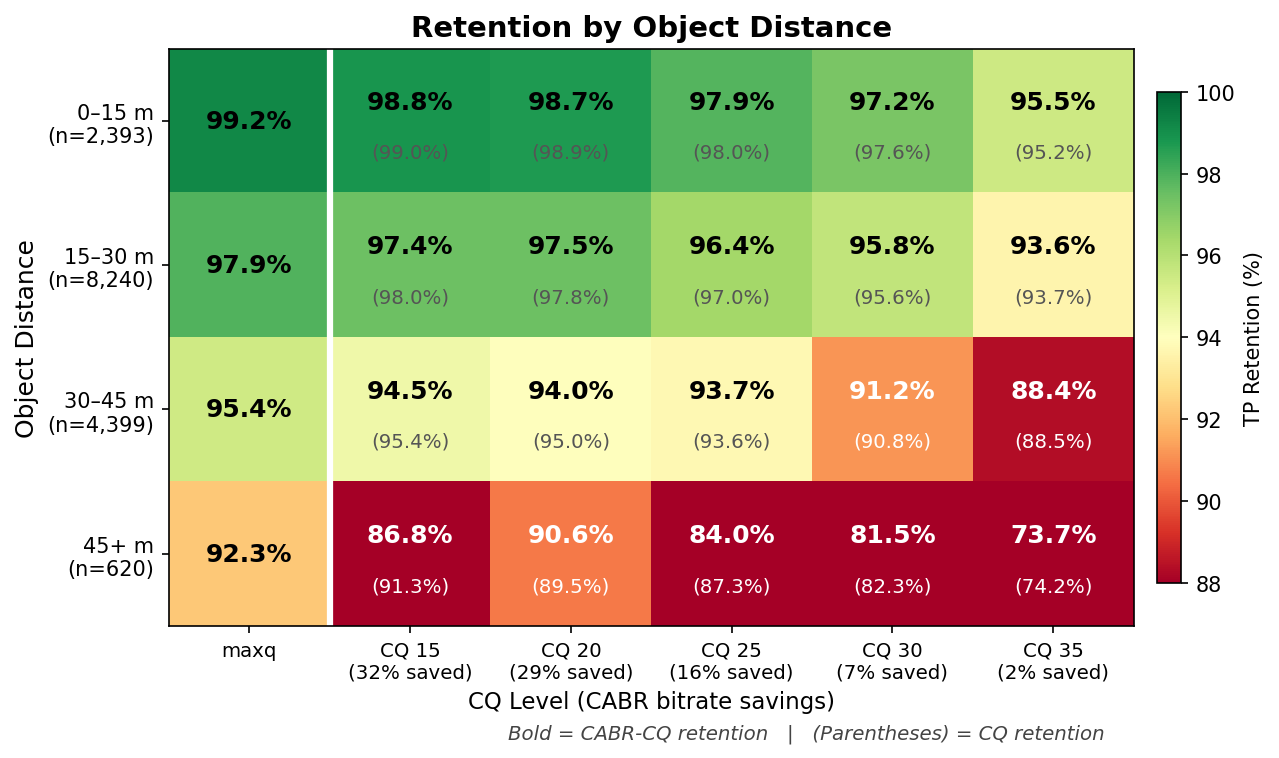
Figure 6: True positive retention by object distance and compression setting. Bold values show CABR-CQ retention; parenthesized values show standard CQ retention. CABR’s bitrate savings over standard encoding are shown per column.
Key takeaways
- Moderate compression preserves 3D detection performance. At moderate CQ values true-positive detections are reasonably robust, with effectively unchanged 3D overlap with ground truth.
- Model retained detection profile under compression. Stable predictions are retained well, while the small fraction of affected detections were already the model’s weak-points and compression shifted their location only slightly, causing crossover detection threshold.
- CABR maxq is a compelling default: It automatically selects the lowest perceptually lossless bitrate with no tuning required. In this study, maxq achieved 97.1% TP retention, and 99.2% object distance retention at 1-15 meter distance – with a 43% bitrate reduction compared to the source.
- Compression impact is measurable, not binary. Each setting produces a specific trade-off. Choosing the right one means understanding that profile for your pipeline, not relying on a pass/fail score.
The canary not only survived; it held steady. If compression meaningfully harms 3D detection, a setup this fragile is where it would show, and what it showed is that moderate compression preserves not just what the model detects, but how it detects it: the same predictions, in the same positions, with the same failure modes.
🤗 Learn more about the research in the White paper in Hugging Face
-> Run Beamr’s ML-safe compression on your own data: beamr.com/autonomous
ML-Safe AV Video Data Testing series:
Part 1: Beamr is Pushing the Boundaries of AV Data Efficiency, Accelerated by NVIDIA
Part 2: ML-Safe AV Video Data Processing Achieves Up to 50% Storage Reduction
Part 3: Deep Dive: Managing the Petabyte-Scale AV Video Data Bottlenecks
Part 4: Beamr’s ML-Safe Video Compression Validated on NVIDIA Cosmos Curator
About the study
This study evaluates one monocular detector (MonoDETR) on one dataset (PandaSet, Car class, 103 sequences, 8,240 frames). Results may not transfer directly to other architectures, object classes, or multi-sensor systems. However, the prediction-tracking methodology, comparing a model’s own outputs on source vs. compressed frames, is architecture-agnostic and can be applied to any detector. Full methodology, subgroup analysis, and statistical details are available in the companion white paper.